
The Net Promoter Score (NPS) is a measure of customer loyalty that is used by firms in many industries, one of those being health insurance. It gained prominence after articles were published in the Harvard Business Review . These articles, by Fred Reichheld of Bain and Company, held that the Net Promoter Score's "willingness to recommend" question was superior to other customer loyalty inquiries. Reichheld wrote that the quesion, "How likely would you be to recommend your [insert a product or service here] to a friend or colleague?" gave consumers a concrete action to consider instead of having to think about their satisfaction in an abstract way.
For the past 12 years, Deft Research has used NPS to measure the loyalty of health plan members. We have found that the measure is a reflection of many aspects of the member experience. The rating a member gives to the willingness to recommend question is usually strongly linked to their experiences with customer service, ease of product use, access to medical and pharmaceutical services, and so on.
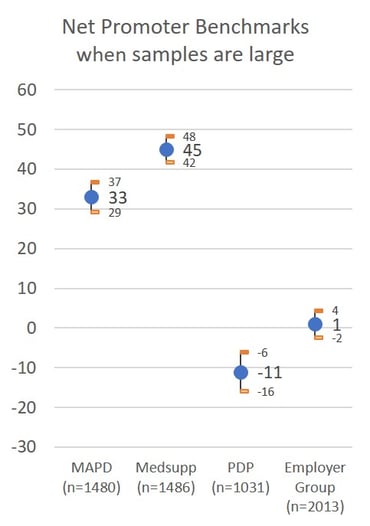
Today, NPS is as popular as ever among health plan management. And with that interest, comes an interest in what makes it change. In other words, if health plans are going to hold themselves accountable for their Net Promoter Score, management wants to know how to maintain and improve it. The first chart includes NPS benchmarks for four lines of health insurance business. Note that the confidence intervals are small. This means that our estimate of NPS is fairly precise. It's precise because the sample size is quite large (all over 1,000 consumer respondents), and this makes the margin of error quite small.
Net Promoter Score Benchmarks
Sample Sizes Impact Confidence Intervals
Confidence Intervals are Important for Managers Trying to Take Effective Action
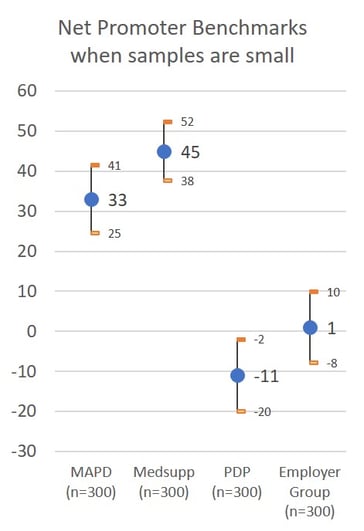
The second chart includes the same NPS data with sample sizes of 300 respondents instead of more than 1,000 as shown in the first chart. For many health plans monitoring NPS over time, 300 responses may be the number obtained over several months. Both charts use a 95% confidence level. The chart shows that when samples are smaller, NPS estimates become less precise. From a statistical perspective, we don't have the confidence to say that differences in estimated scores are actually different. In the second chart, when the samples are composed of 300 responses, the difference between MAPD NPS of 33 and the Medsupp NPS of 45 is not statistically significant - the confidence intervals are large and overlap.
Management should always ask for the confidence intervals of Net Promoter Scores. This ensures that results are being interpreted accurately and prevents an over-reaction to NPS changes that are not real. Management should also consider having NPS presented as a rolling average that includes responses from several monitoring periods. This assures that the number of responses included are sufficient to provide an accurate estimate and better support for managerial decisions.
Learn more about Deft Research's Member Experience Support Services.